Gain the confidence to make investing a bigger part of your life.
170+ lessons for all audiences
Start for free
Become a better investor

What are investors looking at when considering an investment in Coinbase?
Coinbase released some impressive Q1 2021 numbers recently. Before deciding whether or not to invest, let's do some due diligence, diving into some of the risks, and make a case for why and why not.

Share your videos with friends, family, and the world
Coinbase Global, Inc. (the “Company”) today issued estimated results for its first quarter ended March 31, 2021 and an outlook for the full year ending December 31, 2021. First Quarter 2021 Estimated Results* For the first quarter of 2021, the Company currently expects the following as of or for the three months ended March 31, 2021: Verified Users of 56 million Monthly Transacting Users (MTUs) of 6.1 million Assets on Platform of $223 billion, representing 11.3% crypto asset market share Includes $122 billion of Assets on Platform from Institutions Trading Volume of $335 billion Total Revenue of approximately $1.8 billion Net Income of approximately $730 million to $800 million Adjusted EBITDA of approximately $1.1 billion *This information is based on information available to the Company as of the date of this release and is subject to the completion of its quarterly financial closing procedures and review by the Company’s independent registered public accounting firm. Crypto price
Before making an investment, we need to consider what is risk and what are the different types of risks we need to consider with this investment.

After considering the risks, what are some of the reasons to believe we should buy the stock:

Get Coinbase Exchange total trading volume, trading fees, pair list, fee structure, and other cryptocurrency exchange info. Find out the most actively traded coin on Coinbase Exchange.

After considering the risks, what are some of the reasons to believe we should not buy the stock:
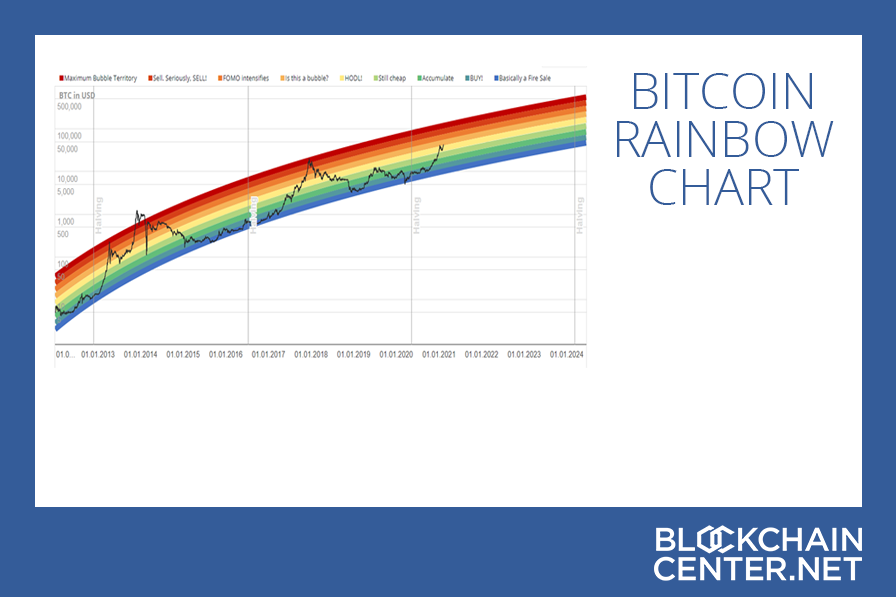
The Rainbow Chart is not investment advice! Past performance is not an indication of future results. The Rainbow Chart is meant to be be a fun way of looking at long term price movements, disregarding the daily volatility "noise". The color bands follow a logarithmic regression (introduced by Bitcoi